|
Exploring network node connectivity and topology using a customized Powershell script. 🔽
Hybrid network topologies can include web application firewalls, reverse proxies, authn/z servers and on-premise backends. Middleware engineers usually need to explore node connectivity each time a new infrastructure implementation is proposed. Most explorations include dns queries, port statuses, ongoing sessions, certificate fields, raw web responses, trace & ping.
Powershell offers a number of commandlets and framework objects that allow to programmatically query remote network nodes. NetNodeView.ps1 is a PowerShell tool that I created with the intent to expedite network exploration during operational testing. 🔸 EXECUTION: Open the NetNodeView.ps1 script with Powershell ISE in the Server from where you need to explore a network.
The main home screen should look like the below snapshot, offering different test options from 0 to 9 : 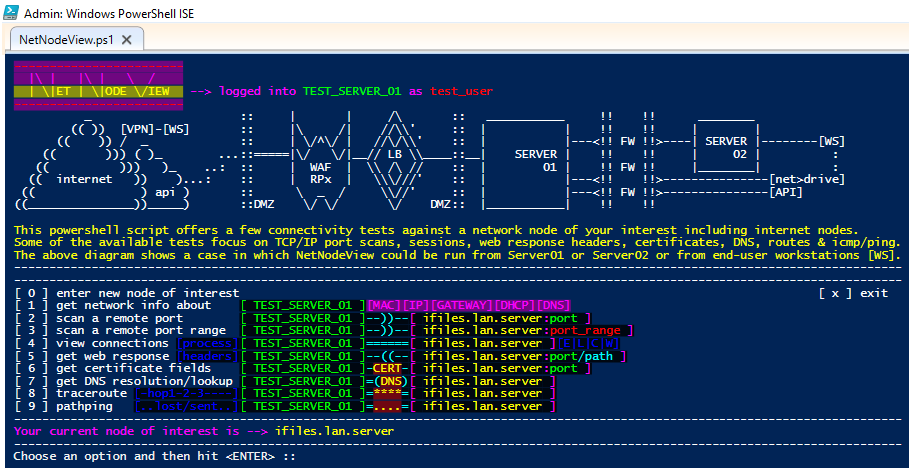
|
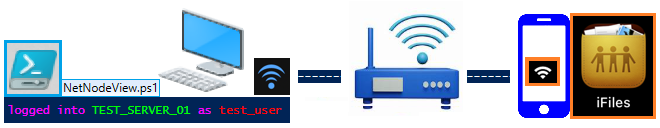
 In our particular test case we are using a simple wi-fi LAN integrated by a Windows Workstation accessing an iFiles server.
 The idea is to test the behaviour of a physical server, also including some explorations of globally served URL resources.
 🔻 Home test network ( "the on-premises infrastructure" ): [ windows_PC ]---[ wi-fi_router ]---[ iFiles_Server ] :
|
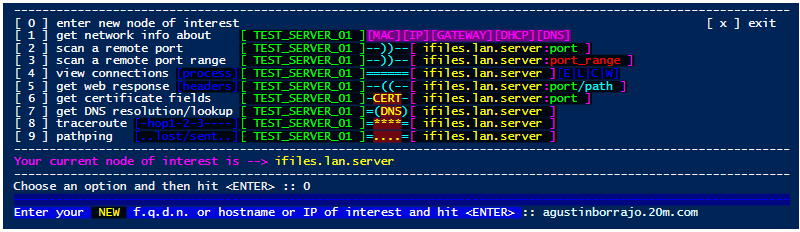
🔸 Option [ 0 ] : Enter a new node of interest at any moment depending on the need to explore different topologies
    🟩 Your network explorations can include IP addresses or Hostnames or Fully Qualified Domain Names or Endpoint resources:
|
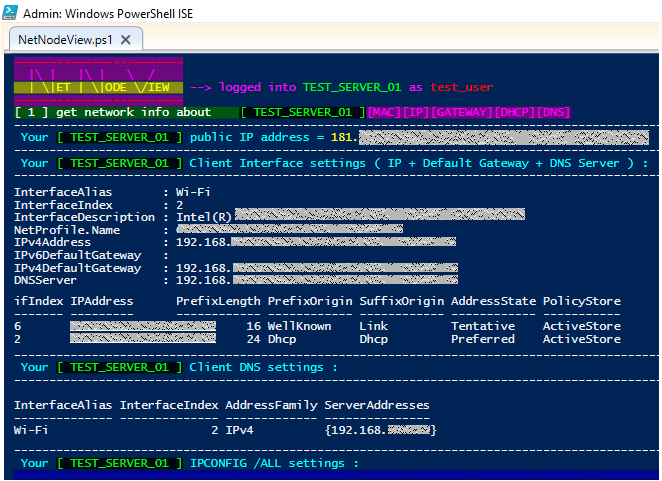
🔸 Option [ 1 ] : Get Network information about the node from where connectivity and topology will be explored
    🟩 Your Server's Public IP Address, Your LAN IP, Default Gateway's IP, DNS IP, MAC Address, Interfaces & IP Routes are shown:
|
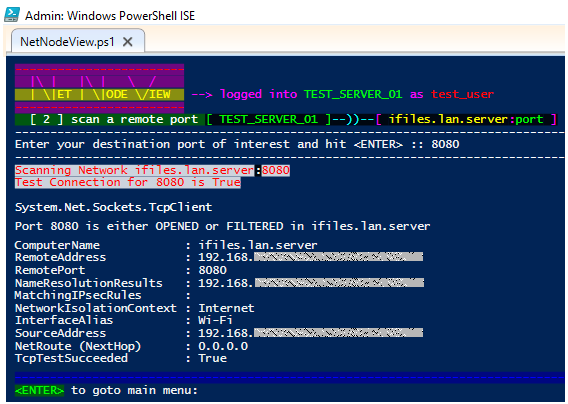
🔸 Option [ 2 ] : Scan a remote TCP/IP Port against the network node that wants to be explored
    🟩 A connection attempt will be performed showing if TCP test succeeded and which interface was involved:
|
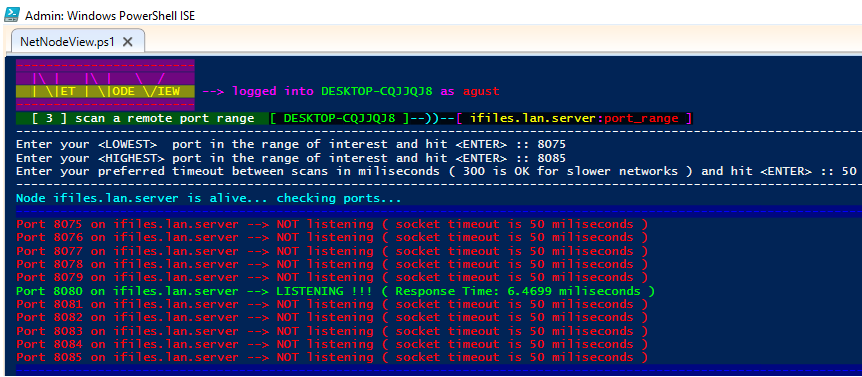
🔸 Option [ 3 ] : Scan a remote TCP/IP Port range against the network node that wants to be explored
    🟩 Although thousands of ports can be explored in a given range, it is recommended to reduce the scope of the exploration.
    🟩 The amount of miliseconds to wait for the timeout can be selected, considering that some hybrid networks can suffer from delays.
    🟩 Once a port is reported as LISTENING, the response time is also informed.
|
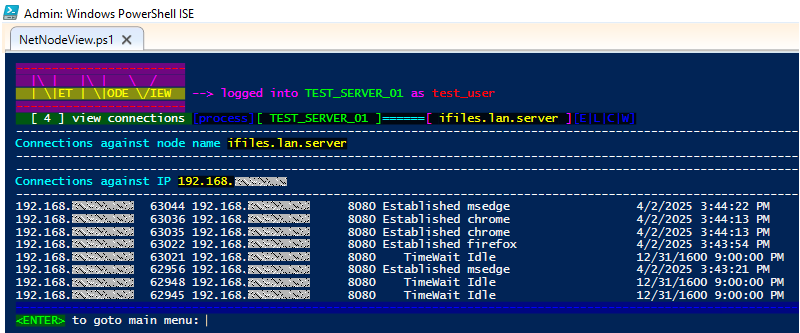
🔸 Option [ 4 ] : Views the ongoing connections from your Server/Work_Station against the node you want to explore
    🟩 If background network services are running in the server where you are logged in, it could be useful to understand the ongoing connections.
    🟩 The name of the process/executable involved in the ongoing connections/sessions is also listed.
    🟩 Connection statuses can be Established, Listening, Close_wait and Time_wait.
|
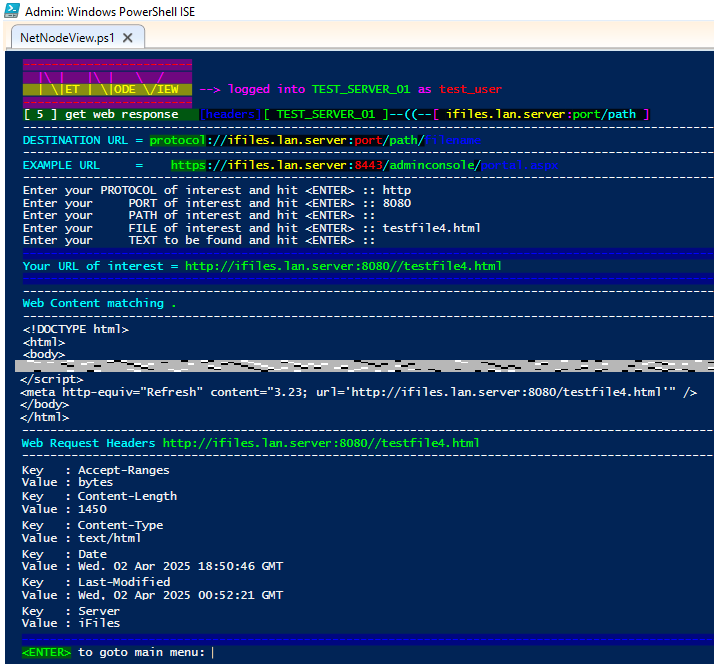
🔸 Option [ 5 ] : Get a web response from a URL that can be reached from the Test Server
    🟩 Destination URL Protocol ( http/https ), Port, Path and File name can be selected.
    🟩 A plain-text-pattern can be grepped against the obtained Web Content.
    🟩 Web Request Header names and values are also collected from the responsive URL.
|
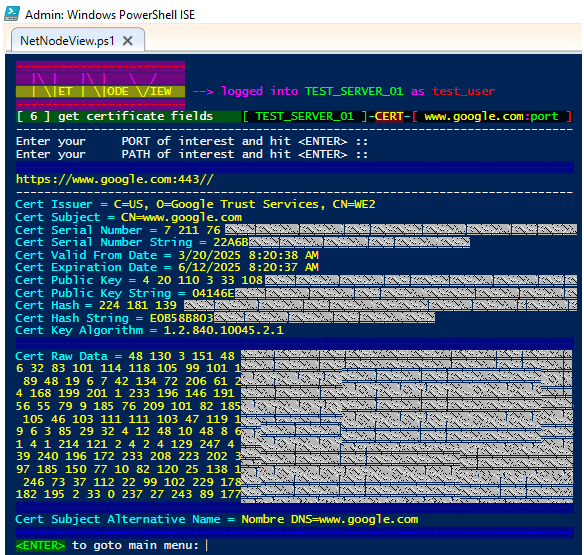
🔸 Option [ 6 ] : Get TLS/SSL certificate fields querying the remote URL of interest
    🟩 Destination Port and Path can be selected for the case of multiple certs and webserver pools.
    🟩 Certificate Issuer, Subject, Serial Number/String and Validity Dates are also collected.
    🟩 Public Key/String and Certificate Hash/String as well as Cert Key Algorithm are displayed.
    🟩 Certificate Raw Data and SAN ( Subject Alternative Name ) complete the offer of this section.
|
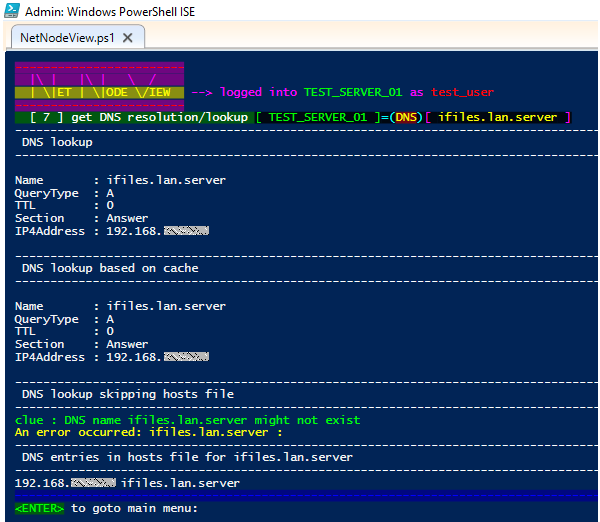
🔸 Option [ 7 ] : DNS lookup focuses also on DNS cache and hosts zonefile entries
    🟩 Concurrent DNS queries help to understand if cache or local settings affect the NS resolution.
|
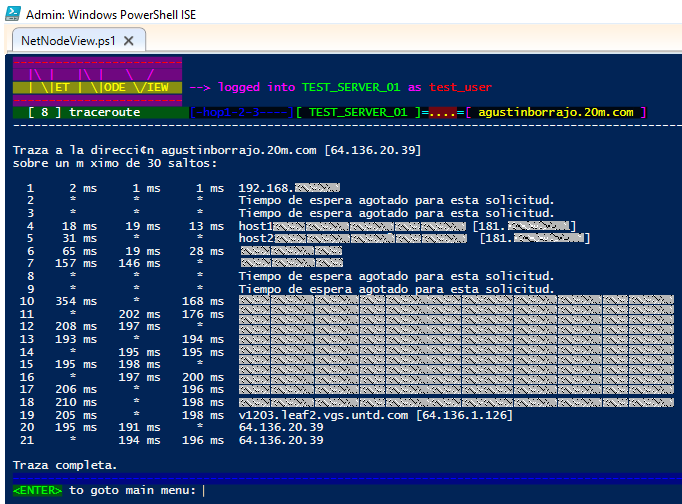
🔸 Option [ 8 ] : Traditional Traceroute relying on the native CMD command
    🟩 Name resolution and the fully qualified domain name of each node is listed where available.
|
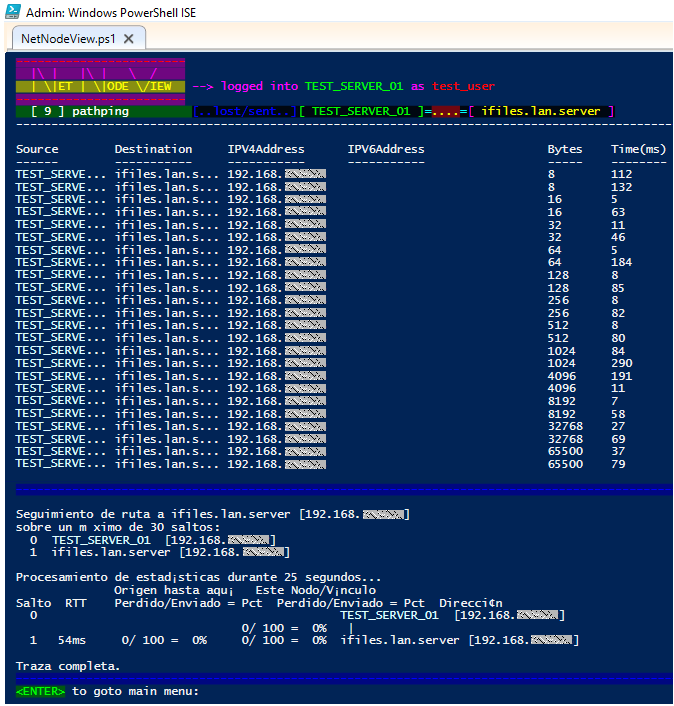
🔸 Option [ 9 ] : A few sets of pings including different byte sizes
    🟩 Pathping, if available in your system, allows NetNodeView to collect stats around lost packets.
|


 📑 github-courtesy-copy